
Skip to content
← ING España SUS tracking

Friction monitoring · SUS

Making satisfaction
measurable across journeys

We introduced a lightweight satisfaction layer on ING's commercial website to capture user sentiment right after key interactions — spotting friction and prioritising improvements.

10QSurvey questions
4Segments tracked
LiveContinuous loop
Role
Senior Product Designer
Company
ING España
Focus
Measurement · Research · Reporting
Read the case study

ING España had analytics. They had A/B tests. They had heuristic reviews. What they didn't have was a way to answer the most basic question in product: do users actually find this easy to use?

When something felt broken, the conversation went in circles. Marketing said one thing. Product said another. Engineering had the data, but the data only showed what happened — not how it felt. Decisions defaulted to whoever argued loudest.

What we needed

A single number that anyone on the team could understand — comparable across journeys, repeatable over time, and benchmarked against the industry. Not another opinion. A score.

Why SUS and not something else

SUS

✓ Chosen

System Usability Scale

10 questions. One score. Takes 90 seconds. Validated across thousands of products, so your 72 actually means something when compared to the industry average of 68.

Perfect for comparing multiple journeys over time — exactly what we needed.

NPS

✗ Not chosen

Net Promoter Score

Measures "would you recommend us?" — great for brand loyalty, useless for spotting a broken fund comparison table. Tells you something is wrong, never where.

Too broad. We needed page-level insights, not relationship sentiment.

CSAT

✗ Not chosen

Customer Satisfaction

One question, hyper-specific to a single moment. Fast, but the scores aren't comparable across different journeys or time periods. You can't build a dashboard from it.

Too narrow. No way to benchmark or track trends.

What the numbers mean

Industry avg 68
< 51Awful
51–67Poor
68–74OK
74–85Good
85–90Excellent
> 90Best

I started with the investment funds journey — the most complex path on the site, and the one where users made real financial decisions. If it worked here, we could roll it to every other journey.

Using a tool already in ING's stack was a deliberate choice — zero engineering overhead meant I could start measuring in weeks, not quarters. The trigger logic was the more important decision: the survey only fires after genuine engagement. Measuring someone who bounced after three seconds would have produced noise, not signal.

01
All funds
list
02
Fund
comparison
03
More
info
04
Fund
detail page
05
Survey
fires ↑
The survey only fires when we know the user has actually tried to use the page — not just glanced at it. Three signals tell us they're genuinely engaged:

Time on page

Fires after a minimum dwell time — bounces and accidental visits filtered out.

Table interaction

Triggered when the user interacts with the fund comparison table — a strong intent signal.

Calculator use

Fires when a user uses the savings or investment calculator — they're evaluating, not browsing.

A single number is just a starting point. The useful question is always: which users, on which journey, on which device? That's where a score becomes a decision. Without segmentation, you know something is wrong — you just can't act on it.

I chose four segments aligned to the questions ING's leadership was already asking: are we losing prospects? Are we fixing the right things post-support? Are mobile users having a different experience? Each segment turned a directional suspicion into something measurable.

Segment 01 — Customer type

Existing customers vs. non-customers

Finding: Current customers rated the experience more positively — they already knew how to navigate ING. Non-customers had to figure it out from scratch, and the friction was visible in the scores.

Segment 02 — Contact history ↑

Post-support users vs. standard users

Key signal: Users who had recently contacted support rated usability lower — even on journeys unrelated to their support issue. This became a leading indicator: a drop in this segment predicted friction before it showed up in conversion data.

Segment 03 — Channel

Commercial website vs. mobile app

Finding: App users rated task completion higher but discovery lower. Website users found browsing easier but task completion harder. Different friction points, different fixes.

Segment 04 — Device ↑

Desktop vs. mobile · iOS vs. Android

Sprint trigger: Fund comparison tables scored significantly lower on mobile than on desktop. This wasn't visible in conversion data — users were completing the journey despite the friction. SUS caught what analytics missed.

The measurement was only useful if it ran without anyone having to remember to trigger it. I designed the loop to fire automatically after every significant release — so satisfaction data arrived as a consequence of shipping, not as an extra task someone had to schedule.

01

Launch

Deploy the survey at the right trigger point. Set the sampling rules once, and it runs on its own.

02

Collect

Responses come in continuously across all tracked journeys. Monitor volume and completion rates weekly.

03

Segment

Break results down by user type, device, channel, and contact history. That's where the real story hides.

04

Prioritise

Rank issues by: biggest drop from benchmark × highest user volume × lowest fix cost. No more gut-feel debates.

05

Fix

Ship targeted improvements tied directly to the friction signals — not to assumptions or stakeholder preferences.

06

Measure again

The loop restarts. New scores show whether the fix worked — or revealed a different problem underneath.

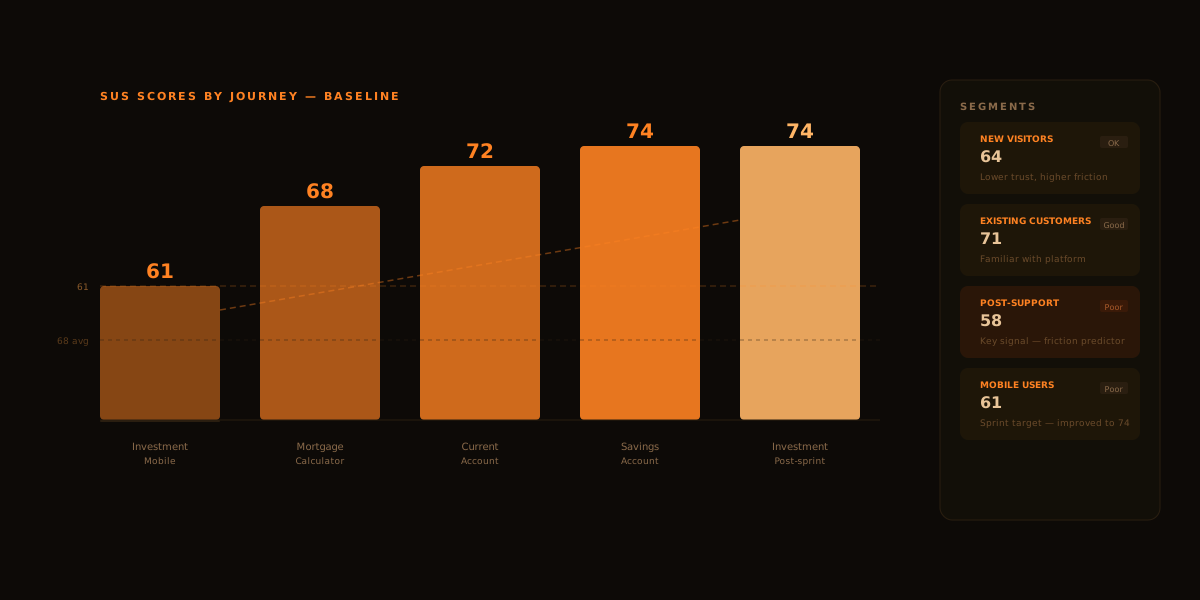
The first time we looked at the dashboard, the conversation in the room changed. Instead of "the investment journey feels a bit clunky," it was "the investment journey scores 61 — that's Poor, and it's our lowest-scoring journey by 10 points." That sentence alone changed how the next sprint was planned.

Baseline scores — across all journeys

Sprint target

61

Poor

Investment
Mobile

68

OK

Fund detail
page

72

OK

All funds
Desktop

74

Good ↑

Investment
Post-sprint

61 → 74
Mobile fund table · One targeted sprint Poor → Good · +13 points

The invisible problem

Users were struggling — and conversion data had no idea

Mobile users rated fund comparison tables as Poor. But they were still completing the journey — they were just having a hard time getting there. Conversion metrics showed nothing unusual. SUS caught what analytics missed: people were struggling in silence.

The leading indicator

Post-support users predicted the next friction wave

Users who had recently contacted support rated usability lower — on every journey, not just the one they'd called about. This became the team's early warning system: a drop in post-support scores reliably preceded a rise in contacts 2–3 weeks later.

The mobile fund table: from Poor to Good in one sprint

Before

58

Poor

Too dense. Filter controls were small. Horizontal scroll wasn't visible. Users had to work hard just to compare two funds on a phone.

→

After sprint

74

Good

Collapsed columns by default. Surfaced top 3 comparison criteria. Added visible scroll affordance. Re-measured 6 weeks after release.

The improvement only happened because SUS made the problem visible. Conversion data hadn't dropped — users were getting through the journey despite the friction. Without the score, this would have stayed invisible until something broke.

What changed for the team

Opinions became scores

"The product feels hard to use" stopped being an argument. It became a 61 with a segment breakdown — and everyone could see it.

Measurement entered the workflow

After every significant release, the loop ran automatically. Teams stopped asking "did users like it?" and started tracking the answer as a live number.

Product, dev and marketing aligned

A shared score gave everyone the same starting point. Prioritisation debates that used to take days started taking minutes.

Mobile friction became visible

Device segmentation caught problems conversion data couldn't see — and gave sprint teams a clear, defensible target to fix.